It’s not always about the amount of data you have, it’s about what you can do with it. But how can you make sense of your engagement data and take action on it?
ON24 Intelligence’s Custom Leads Report can help.
ON24 Intelligence is a set of analytics dashboards and reports that provides real-time reporting on the performance of your campaigns, programs, and content, including detailed data on audience conversion and engagement.
If you’re on a hunt for your best leads, this report will help you find them.
BUILDING YOUR REPORT
Use this report to build a unique view of the full details of your leads’ activities and engagement.
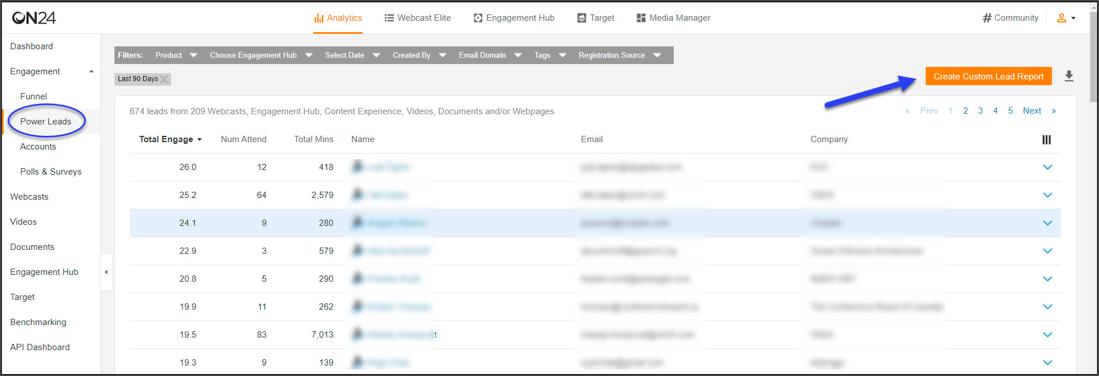
You can access the Custom Leads Report from the Power Leads page in the ON24 Analytics dashboard.

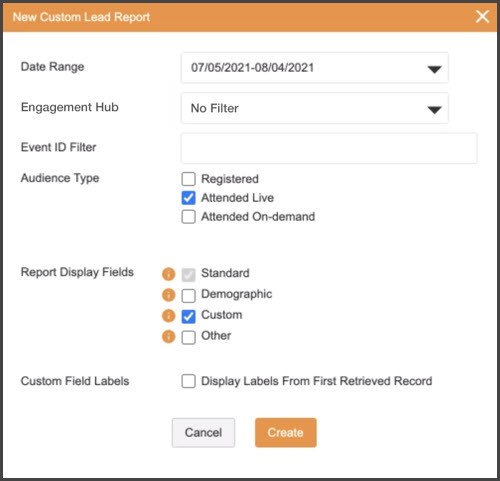
To start, you’ll need to select a date range. This can be the last 30 days, 90 days, two years, or your own custom range.
You can add a filter to pull data from within one specific Engagement Hub. You can also filter by the Event ID of any webinar(s) in your account.
Next, you can filter by audience type. This can include leads who registered for an event, attended live, attended on-demand, or attended as live or on-demand.
You can then use the Report Display Fields checkboxes to customize the data fields included in the report. These include:
-
- Standard: User ID, Email, First Name, Last Name, Title, Work Phone Number, Registration Source, Event ID, Event Title, Event Timestamp, Registration Timestamp, Last Viewed Timestamp, Minutes Viewed Live, Minutes Viewed On-Demand, Total Minutes Viewed.
- Demographic: Address 1, Address 2, City, State, Country, Zip Code, Company Name, Industry, Job Function, Company Size.
- Custom: Will include all custom registration fields that were set up for each webinar.
- Other: Marketing Email, Event Email, Operating System, Browser.
Lastly, you can include Custom Field Labels. If checked, the report will use the labels from the Custom Registration Fields as headers for the columns. This is useful if you use the same custom registration fields for all webinars.

VIEWING YOUR REPORT
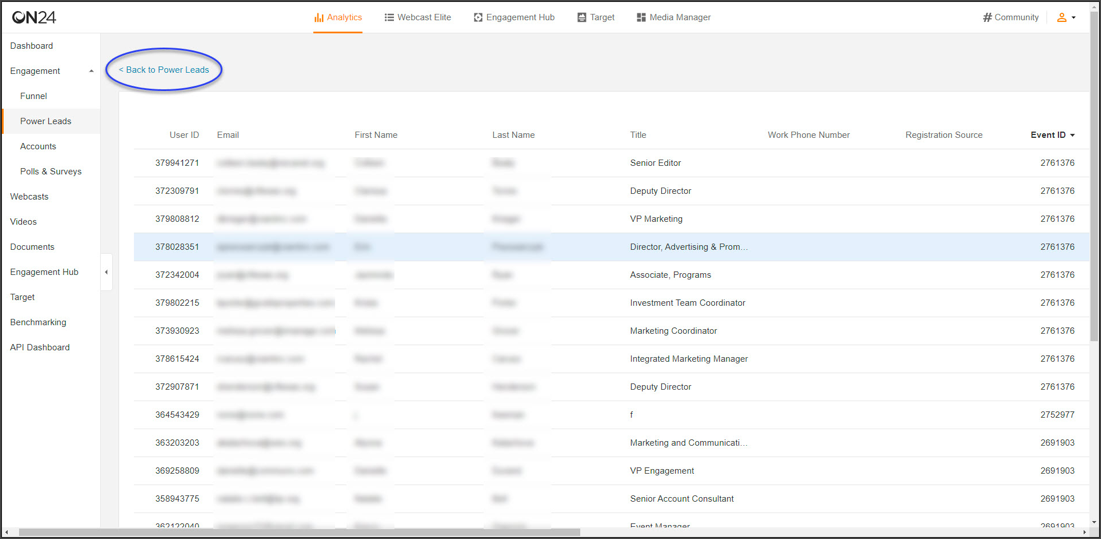
Once you run your report, the data will display in a table. Each row corresponds to one lead and includes their registration details.

Each column includes the data fields selected in the Report Display Field checkboxes in the report setup. When first created, the report will sort by Event ID. You will see each event and all the registrants/attendees for that event in one place in the report.
You can also change the way the report sorts by selecting the User ID or Email Address columns to see the data ordered lead-by-lead, with a row for each event.
If you’d like to view your data in Excel, you can download the file.
USING YOUR REPORT

The Custom Leads Report can help you get to know your audience beyond just a click and start to understand their interests and behaviors.
By diving deeper into your engagement data, you can start to look for trends and identify opportunities to further personalize interactions with your leads.
*Note: The Custom Leads Report is accessible to all users with the Advanced Reporting and Analytics add-on package with ON24 Intelligence. Reach out to your CSM for more details.

