Digital Experience Conversion
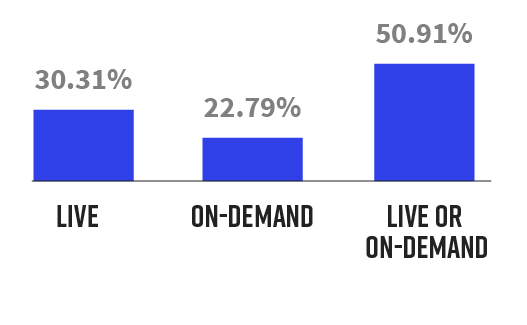
The combined conversion rate for live and on-demand consumption of webinars was 50.91%, a decline of 3.4 percentage points from the previous quarter. This conversion rate is consistent with Q3 2021.
Q3 is traditionally a quarter with a seasonality and a decline in audience participation and marketing output. While there were modest declines in some audience metrics, like conversion rates, audience participation with digital experiences increased both in engagement metrics and CTAs. Marketers should evaluate their engagement and CTA strategy to ensure they are driving audiences to the right opportunities based on content they are reviewing.
Audience
Attendee Time
The average attendee was 54 minutes, in line with the previous quarter.
Attendance
The average number of webinar attendees in Q3 2022 was 218, an increase of 2.78% from the previous quarter.

Engagement
Questions
Not all digital experiences include engagement with Q&A. Of those that did, the average number of questions was 18, up from 17 the previous quarter.
Calls to Action
The overall CTA conversion per attendee decreased by 4.67% from the previous quarter.
Engagement Actions
Attendees were more engaged in webinars in Q3 2022, with a slight increase.

Content Experiences
Conversion
Average conversion from registration to attendance was 37.43%, a decrease from the previous quarter but increase of 2.29 percentage points from Q3 2021.
Attendee Length
The average length of attendance for Q3 2022 was 25.28 minutes, a decrease of 3 minutes from the previous quarter.
Calls to Action
Attendee engagement with calls to action had a dramatic increase of 82.49% from the previous quarter.

Personalization
Conversion
The conversion rate for registration to attendance of personalized digital experiences was 50.29%, a 1.78 percentage point dip from the previous quarter.
Attendee Length
The average length of attendance was 28.79 minutes.
Calls to Action
Attendee engagement with CTAs increased dramatically from the previous quarter, 171.06%.

Conclusion
Engagement is the currency of marketing. With increased audience participation in engagement and CTAs, marketers should feel confident heading into Q4 execution and 2023 planning. Marketers must prioritize the integrations and processes required to act on this rich data to ensure that they are getting optimal value from investments in digital experiences.