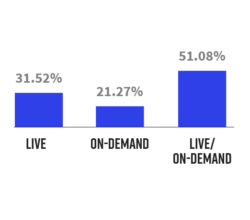
Digital Experience Conversion
The combined conversion rate for live and on-demand consumption of webinars was 51.08%.
Live conversion was 31.52% and on-demand conversion was 21.27%. All conversion rates were in line with Q1 2022.
Audiences continue to attend and engage with digital experiences. While we have seen stabilization of registration to attendee conversion rates, attendees who are present during digital experiences are more actively engaged than the previous quarter. Marketers looking to improve their registration to conversion attendee rates should reflect on their promotional strategy and see if it is aligned with current registration behavior, which shows that attendees are registering closer to the day of the event, than in previous years.
Audience
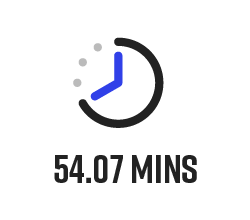
Attendee Time
The average attendee was 54.07 minutes, a modest, 90 second, decrease from the previous quarter.
Attendance
The average number of webinar attendees in Q1 2022 was 110, an increase of 2.27% from Q1 2022.

Engagement
Questions
Not all digital experiences include engagement with Q&A. Of those that did, the average number of questions was 9.22. This is an increase of 10.14% quarter over quarter.
Calls to Action
The overall CTA conversion per attendee increased 11.63% from Q1 2022.
Engagement Actions
Attendees were more engaged in webinars in Q2 2022, by 13.50% from the previous quarter.

Content Experiences
Conversion
Average conversion from registration to attendance was 41.78%, an increase of 6.01 percentage points from Q1 2022.
Attendee Length
The average length of attendance for Q2 2022 increased by 8.54% to 25.2 minutes.
Calls to Action
Attendee engagement with the “Request a Demo” CTA increased by 53.16% quarter over quarter.

Personalization
Conversion
The conversion rate for registration to attendance of personalized digital experiences was 54.58%, an increase of 2.58 percentage points.
Attendee Length
The average length of attendance was 27.91 minutes, consistent with the previous quarter.
Calls to Action
Attendee engagement with CTAs increased 70.50% from Q1 2022.
Conclusion
Engagement continued to increase across digital experience types in Q2 2022. Marketers must consistently evaluate their format and digital content, to continually optimize their marketing mix for audience preferences. Acting on the data from this engagement is paramount for marketers across b-to-b organizations.