Digital Experience Conversion
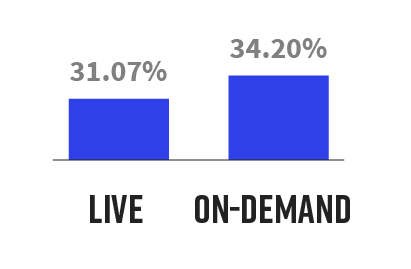
The conversion rates for live attendees was 31.07% and on-demand was 34.20%. Live rates increased by 4.28 percentage points and on-demand increased 1.86 percentage points.
This report will evaluate the performance of digital experiences in the manufacturing industry. It looks at how companies are deploying digital experiences and how audiences are consuming and interacting with this content. It also evaluates this data against all industry data, providing takeaways for areas of improvement.
The manufacturing industry experienced a seasonal shift in conversion rates, much like other industries. The main metrics impacted with live conversion rates, resulting in more audiences engaging with on-demand versions of webinars. Importantly, engagement remained strong and increased across several categories in Q3 2022.
Audience
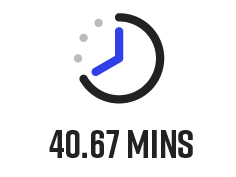
Attendee Time
The average length of attendance for manufacturing webinars was 40.67, a decrease of three minutes from the previous quarter.
Attendance
The average number of webinar attendees in Q3 2022 was 186, an increase of 21 from the previous quarter.

Engagement
Questions
Manufacturing audiences asked 14.91 questions per webinar in Q3 2022, an increase of 16.56% from Q2 2022.
Engagement Actions
Manufacturing webinars had an increase in overall engagement per attendee, up 7.98% from the previous quarter.
Reactions
As manufacturers have adopted reactions into webinars, audiences have engaged increasingly, up 72.19% from Q2 2022.

Content Experiences
Conversion
For curated content experiences, manufacturing audiences converted at 20.41%, a decrease of six percentage points from Q2 2022.
Attendee Time
On curated experiences, manufacturing audiences spent on average 31.68 minutes, a modest increase from Q2 2022.
Content Consumption
Manufacturing audiences consumed 49.28% more content than Q2 2022.
Calls to Action
Audiences leveraging CTAs increased 611.15% quarter over quarter.

Personalized Experiences
Conversion
The conversion rate for registration to attendance of personalized digital experiences was 42.86%, a drop of 5.46 percentage points from Q2 2022.
Attendance Length
The average length of attendance was 29.64 minutes, an increase of a minute from Q2 2022.
Content Consumption
Manufacturing audiences consumed 34.99% more content than Q2 2022.

Conclusion
Based on manufacturing audiences preferences for consuming content following a live experience and propensity for engagement during curated experiences, teams must evaluate their always-on strategy for content. Enabling audiences to self-serve content will further improve content ROI and lengthen the shelf life of content. It is critical that manufactures also set up sales and marketing plays to act on the engagement that is created during these on-demand experiences.