Digital Experiences Benchmark: Financial Services Q2 2021 Report

OVERVIEW

This report will evaluate the performance of digital experiences in the financial services industry. It looks at how companies are deploying digital experiences and how audiences are consuming and interacting with this content. It also evaluates this data against all industry data, providing takeaways for areas of improvement.

Conversion rates to live and on-demand webinars continue to be in line with all industry average. Additionally, conversion rates from Q1 to Q2 in the financial services industry were relatively constant. The average length of attendance increased quarter over quarter by a minute, to 45 minutes. However, the average number of questions asked during experiences dropped to 14. Yet, financial services webinars had significantly more (56%) engagement through Calls to Action than other industries in Q2.

For personalized experiences, conversion rates increased within the industry and outpaced all industry average. A strong signal that financial services marketers should consider the curation of content for specific customers and use cases. 

AUDIENCE

Digital Experience Conversion

Financial services audiences converted to live and on-demand webinars at rates very similar to the all industry average. For financial services webinars, the conversion rate to live attendees was 35.3% and 25% for on-demand versions.

Attendance

The average number of webinar attendees in financial services in Q2 2021 was 117.

Attendee Time

The average length of attendance for a financial services webinar was 45 minutes, compared to 52 for all industry average. 

ENGAGEMENT

Questions

Financial services webinars are on the decline with an average number of questions asked being 14 in Q2, a drop of 4 from Q1.

Calls to Action

However, financial services audiences conversion to meetings was 58 percent higher than all industry average.

Engagement Actions

Financial services audiences were less engaged during digital experiences, taking 2.2 less engagement actions per experience than the previous quarter.

Content Experiences & Personalized Experiences

Personalized Experience Conversion

Financial services audiences converted on pace with the all industry average for conversion for personalized experiences at 71%. This was an increase of 8 percentage points.

Personalized Experience Length of Attendance

Financial services audiences outspaced industry average by 14 minutes at 42 minutes for average length of session within a personalized experience.

Content Experience Conversion

Financial services audiences converted to attendees of content experiences at a rate that was lower than industry average, by 8 percentage points.

Content Experience Length of Attendance

Interestingly, financial services audiences that joined content experiences stayed 9 percent longer than industry average. 

Themes


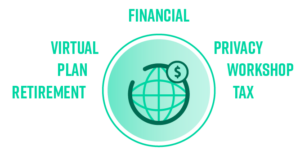
The key themes coming from financial services organizations for digital experiences include: 

CONCLUSION


Financial services marketers continue to lead the pack with personalized experiences with significantly higher conversion and attendance rates versus other industries. With a dip of engagement via questions during webinars, marketers must think about how to set up the appropriate content to enable discussions through experiences. These marketers must also build on the momentum from CTAs following an experience and ensure follow-up to that next action is timely and relevant.