Q3 Report: Digital Experiences Benchmark

Overview

The third quarter of 2020 is one that was expected to have some leveling out in the digital experiences landscape as it would have been after the initial flurry of all physical events moving to digital and it fell during the summer months, a historically slower period across marketing channels. The data we’re seeing in Q3 showed some leveling out in terms the initial attendance spike in Q2 2020 being the initial peak of physical events being cancelled and a quick movement to replace them digitally. However, we saw engagement actions from audiences increase during this period.

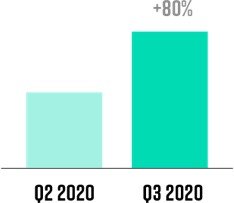
The key trend for marketers to pay attention to is the increase in the rate of personalized digital experiences being created.

With an increase of 78% from Q2 to Q3, marketers are recognizing that to stand out, they must be different.

This demonstrated that marketers are moving towards more personalized experiences, rather than a one-size fits all approach to marketing. This is best practice and a trend that will be important to consider as we begin planning for 2021.

While we saw a dip in attendance and conversion, importantly engagement during the digital experiences continued to rise.

This is an important factor for marketers to keep in mind as they understand the digital-first buyer’s journey. Key data related to:

Audience

Digital Experience Conversion

After reaching a high of 64.2% registrant to attendee conversion in Q2 2020, we saw that level back down to 53.9% in Q3 2020.

Attendance

With a dip in conversion, the total number of attendees also leveled off from Q2. The overall attendee rate fell 24% but on-demand viewing only dropped by 16%. This shows that audiences sustained their on-demand viewing of digital experiences at a more significant rate than live experiences. This underscores the importance of having an on-demand strategy for your events.

Attendee Time

The average attendee duration during digital experiences slipped an average of 4 minutes from Q2 2020 51 minutes to 47 minutes in Q3 2020.

Engagement

Questions

Not all digital experiences include a question and answer portion. Of those that did, the average number of questions dipped from an average of 13.4 questions in Q2 2020 to 8.1 in Q3 2020.

Calls to Action

Attendees are increasingly engaging with conversion tactics in digital experiences. The CTAs taken by attendees during live experiences rose
91% from Q2 2020 to Q3 2020. This is a dramatic increase of 543% from Q3 2019. On-demand attendees had a 38.5% increase in CTA engagement from Q2 to Q3 of 2020.

Content Experiences

Attendance

One of the trends we’ve been tracking is how audiences are consuming and craving on-demand experiences. With the rise of marketers evaluating buyer enablement trends, this has been critical to see how audiences would respond. Not surprisingly, there was a leveling out of attendance to content experiences, dipping 4.7% from Q2 2020 to Q3 2020. This is still 963% more attendees than Q3 2019.

Attendee Length

The average attendee view time of content experience dropped from 59 minutes to 54 minutes, a leveling out but not substantial change from Q2 2020 to Q3 2020.

Content Experience Curation

The experiences marketers are building have continued to rely on video and webinar content. From Q2 2020 to Q3 2020, the increase in webinar content and video content on these experiences grew 42.7% and 25.6% respectively.

Rate Of Creation

Content experiences had a leveling off in Q3, after a 114% increase from Q1 to Q2, we saw Q2 to Q3 decrease by 11%. This is in line with expectations since the curated experiences are created for longevity and marketer must focus on honing those experiences and promoting them to audiences.

Personalized Experiences

Rate Of Creation

As the digital-first marketing world continues, marketers are now honing their strategies with personalized digital experiences. Personalized digital experiences increased by 80% from Q2 to Q3. This signals the need for marketers to replace in-person sales eff?orts and supplementing account-based experiences for new buyers.

Attendance

The attendance length for digital experiences did see a leveling out from Q2 2020 to Q3 2020. In Q2 2020 personalized digital experiences saw an average rate of attendance of 63 minutes, which dropped to 53 minutes in Q3.

Conversion Rate

The conversion rate for registration to attendance of personalized digital experiences also rose over the past quarter, up 25.9%.

Attendees

Impressively, the rate of registration for these personalized experiences grew 78.6% from Q2 to Q3 2020.