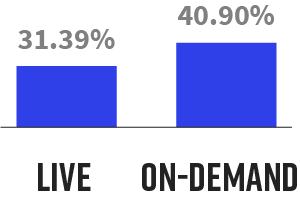
Digital Experience Conversion
The conversion rate for live consumption of webinars was 31.39% and 40.90% for on-demand.
This report will evaluate the performance of digital
experiences in the life sciences industry. It looks at how companies are deploying digital experiences and how audiences are consuming and interacting with this content. It also evaluates this data against all industry data, providing takeaways for areas of improvement.
In Q1 2022, life sciences audiences converted at a higher rate to the on-demand version of webinars than the live version. This demonstrates the need for marketers to consider the time and date of their events, to capture more live attendees. There was an increase in the number of attendees to content experiences, but CTA and engagement didn’t hold
steady. Life sciences marketers must make sure these experiences are aligned with the appropriate CTAs to allow audiences to continue to educate themselves.
Audience
Attendee Time
Life sciences audiences attended webinars for 51.54 minutes on average, 2 minutes shy of Q4 2021.

Total Attendees
The average number of webinar attendees rose 43.71% from Q4 2021 to 221.04.

Engagement
Questions
Life sciences audiences asked more questions than the previous quarter up to 26 questions on average, up 31.38% from the previous quarter.
CALLS TO ACTION
Life sciences audiences increased their utilization of CTAs, up 81.99% from the previous quarter.
Engagement Actions
Life sciences audiences were more engaged in Q1 2022, with an 33.60% increase from the previous quarter.

Content Experiences & Personalized Experiences
Conversion
Personalized content experience conversion increased quarter over quarter 78.32%, up 6.05 percentage points.
Conversion TO ATTENDANCE
When evaluating conversion to attendance for personalized and curated content experiences, life sciences audiences outpace other industries. Life sciences audiences converted, respectively, 4.6 and 7.3 percentage points higher than industry average.
Attendee Time
Life sciences audiences stayed on personalized experiences for 34.91 minutes, and on curated experiences for 25 minutes.

Themes
The key themes coming from life sciences organizations for digital experiences include:
Conclusion
Life sciences marketers continue to drive interest and interaction with their digital experiences. Webinar engagement continued to increase and the same best practices applied to webinars should be applied to content experiences, to improve engagement and CTAs taken by attendees. This will allow life sciences marketers to capture more data to be able to better serve these audiences with future experiences.