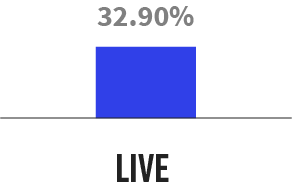
Live Conversion
Conversion to live webinars remained consistent with the previous quarter at 32.90%.
This report will evaluate the performance of digital experiences in
the technology industry. It looks at how companies are deploying
digital experiences and how audiences are consuming and
interacting with this content. It also evaluates this data against all
industry data, providing takeaways for areas of improvement.
Technology audiences remained highly engaged in digital
experiences in Q1 2022. There was a slight decline in conversion to
attendee of on-demand webinars, but live webinar attendees was in
line with Q4 2021. More importantly, engagement metrics and CTAs
taken increased in Q1 2022. Curated content experiences and
personalized experiences also performed well, signaling that
marketers that aren’t using those strategies should evaluate them
for the remaining quarters of 2022.
Live Conversion
Conversion to live webinars remained consistent with the previous quarter at 32.90%.
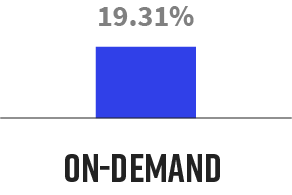
On-Demand Conversion
There was a drop of 5.89 percentage points in conversion to on-demand viewing to 19.31% quarter over quarter.
Attendee Time
Technology audiences’ average time increased by nearly five minutes to 59.59 minutes in Q1 2022, from the previous quarter.

Attendance
The average number of webinar attendees in Q4 2021 was 217. It increased by 15.52% to 250 in Q1 2022.

Questions
Technology audiences averaged 18.78 questions per experience, an increase of 32.22% from Q4 2021.
Calls to Action
Technology audiences overall conversation with a CTA,
including book a meeting or free trial, increased 32.90% quarter over quarter.
Engagement Actions
The engagement rate during experiences increased in Q1 2022 by 35.49 in engagement actions taken per attendee.

Conversion
Technology audiences converted more to personalized experiences quarter over quarter to 52.13%.
Attendance
Technology audiences stayed longer on curated experiences in Q1 2022, averaging 26.49 minutes. An increase of 22.39% quarter over quarter.
Calls to Action
For curated experiences, audiences converted via CTA 106.47% more in Q1 2022 than in Q4 2021.

The key themes coming from technology organizations for digital experiences include:
Despite an increase in the number of physical events, Q1 2022 saw increased engagement in digital experiences for technology audiences. Companies must continue to evaluate audience behavior and look for ways to innovate in digital engagement. For Q2 and beyond, technology marketers must carefully watch engagement rates and compare them against their various categories of digital experiences.
This report reviews the quarterly and annual trends we saw in 2021. We will discuss the overall digital experiences landscape, which includes webinars, curated experiences and personalized experiences.