Digital Experience Conversion
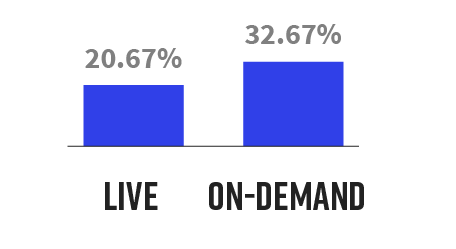
The conversion rate for live consumption of webinars was 20.67% and 32.67% for on-demand in Q3 2022.
This report will evaluate the performance of digital experiences in the life sciences industry.It looks at how companies are deploying digital experiences and how audiences are consuming and interacting with this content.It also evaluates this data against all industry data, providing takeaways for areas of improvement.
Life sciences audiences continue to have a higher conversion rate to post-live viewing of digital experience content. This is an important factor as teams plan experiences to ensure that audiences, regardless of when they join, have an engaging experience.There is a significant opportunity for life sciences marketers to reimagine the days/times of experiences as well as “re-air” events at popular viewing times.Additionally, overall conversion rates saw a decrease, which is likely due to the seasonal decline of Summer months.
Audience
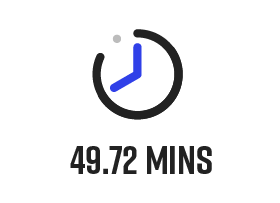
Attendee Time
Life sciences audiences attended webinars for 49.72 minutes on average, a slight increase from Q2 2022.
Total Attendees
The average number of webinar attendees was 178 in Q3 2022, a
decrease of 4.76% from the previous quarter.

Engagement
Questions
Life sciences audiences asked 21 questions per webinar on average, a decline of one question from Q2 2022.
Engagement Actions
Life sciences marketers continued to enable reactions into experiences and audience engagement with them increased 52.93% from the previous quarter.
Calls to Action
Life sciences audiences decreased engagement with CTAs by 14.03% from the previous quarter.
Content Experiences
Conversion
Content experience conversion increased quarter over quarter to 38.08%, up 3.7 percentage points.
Content Consumption
Average content consumed per attendee rose 28.70% from Q2 2022.
Attendee Time
Life sciences audiences stayed on curated content experiences for 32.49 minutes in Q3 2022, a six minute increase from the previous quarter.
Calls to Action
Engagement with the “Book a Meeting” increased 194.32% from the previous quarter.

Personalized Experiences
Conversion
Personalized content experience conversion was 51.32%, an increase of 16.15 percentage points from the previous quarter.
Attendee Length
Life sciences audiences stayed on personalized experiences for 37.52 minutes, an increase of seven minutes from Q2 2022.
Calls to Action
Audience engagement with an opportunity for free trials increased 12.17% quarter over quarter.
Conclusion
Life sciences marketers have an opportunity for improvement in better aligning CTAs with experiences, given that most audiences join on-demand. This could also include training presenters about directing people to the CTAs at both the beginning and end of the experience. It is also important to experiment with alternative timing for events to better fit audience needs.